

agno_traces and agno_spans in the same db you already use for sessions and memory.
Your data never leaves your db
This is the difference between AgentOS tracing and hosted observability platforms.| AgentOS tracing | Hosted observability SaaS | |
|---|---|---|
| Where traces live | Your database | Their servers |
| Data egress | None | Every prompt, tool call, and response leaves your network |
| Vendor dependency | None | Your observability stops if they go down or you stop paying |
| Cost model | Your existing database | Per-seat or per-event billing |
| Querying | Direct SQL on your tables | Their API and UI only |
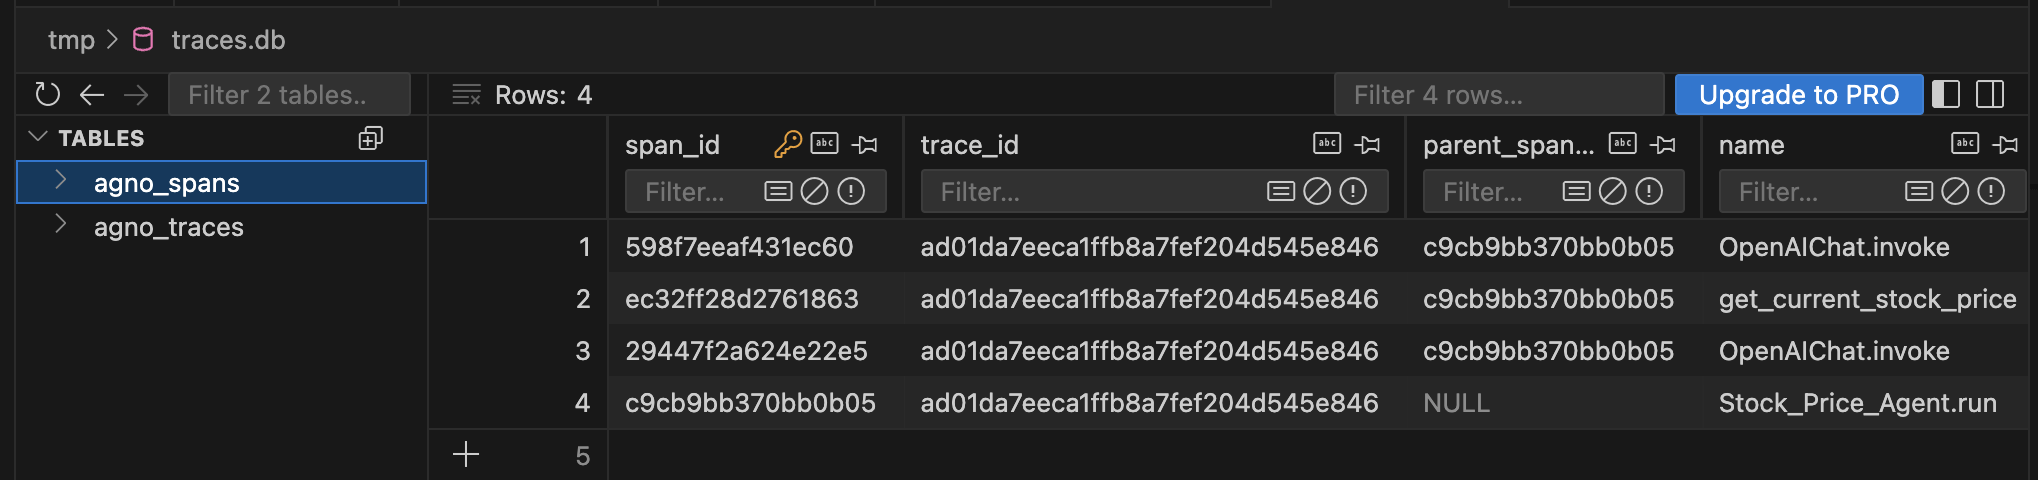
What gets captured
| Span | Attributes |
|---|---|
| Run | agent_id, user_id, session_id, latency, status |
| LLM call | Model, prompt tokens, completion tokens, invocation parameters, tool calls |
| Tool | Tool name, arguments, result, duration, error (if any) |
| Team delegation | Team name, member runs as nested spans |
| Workflow step | Step name, step type, input/output |
In the AgentOS UI
The control plane renders the same traces visually. Click a run to see the full tree: LLM hops, tool calls with their inputs and outputs, and sub-agent traces. Filter by user, session, or time range.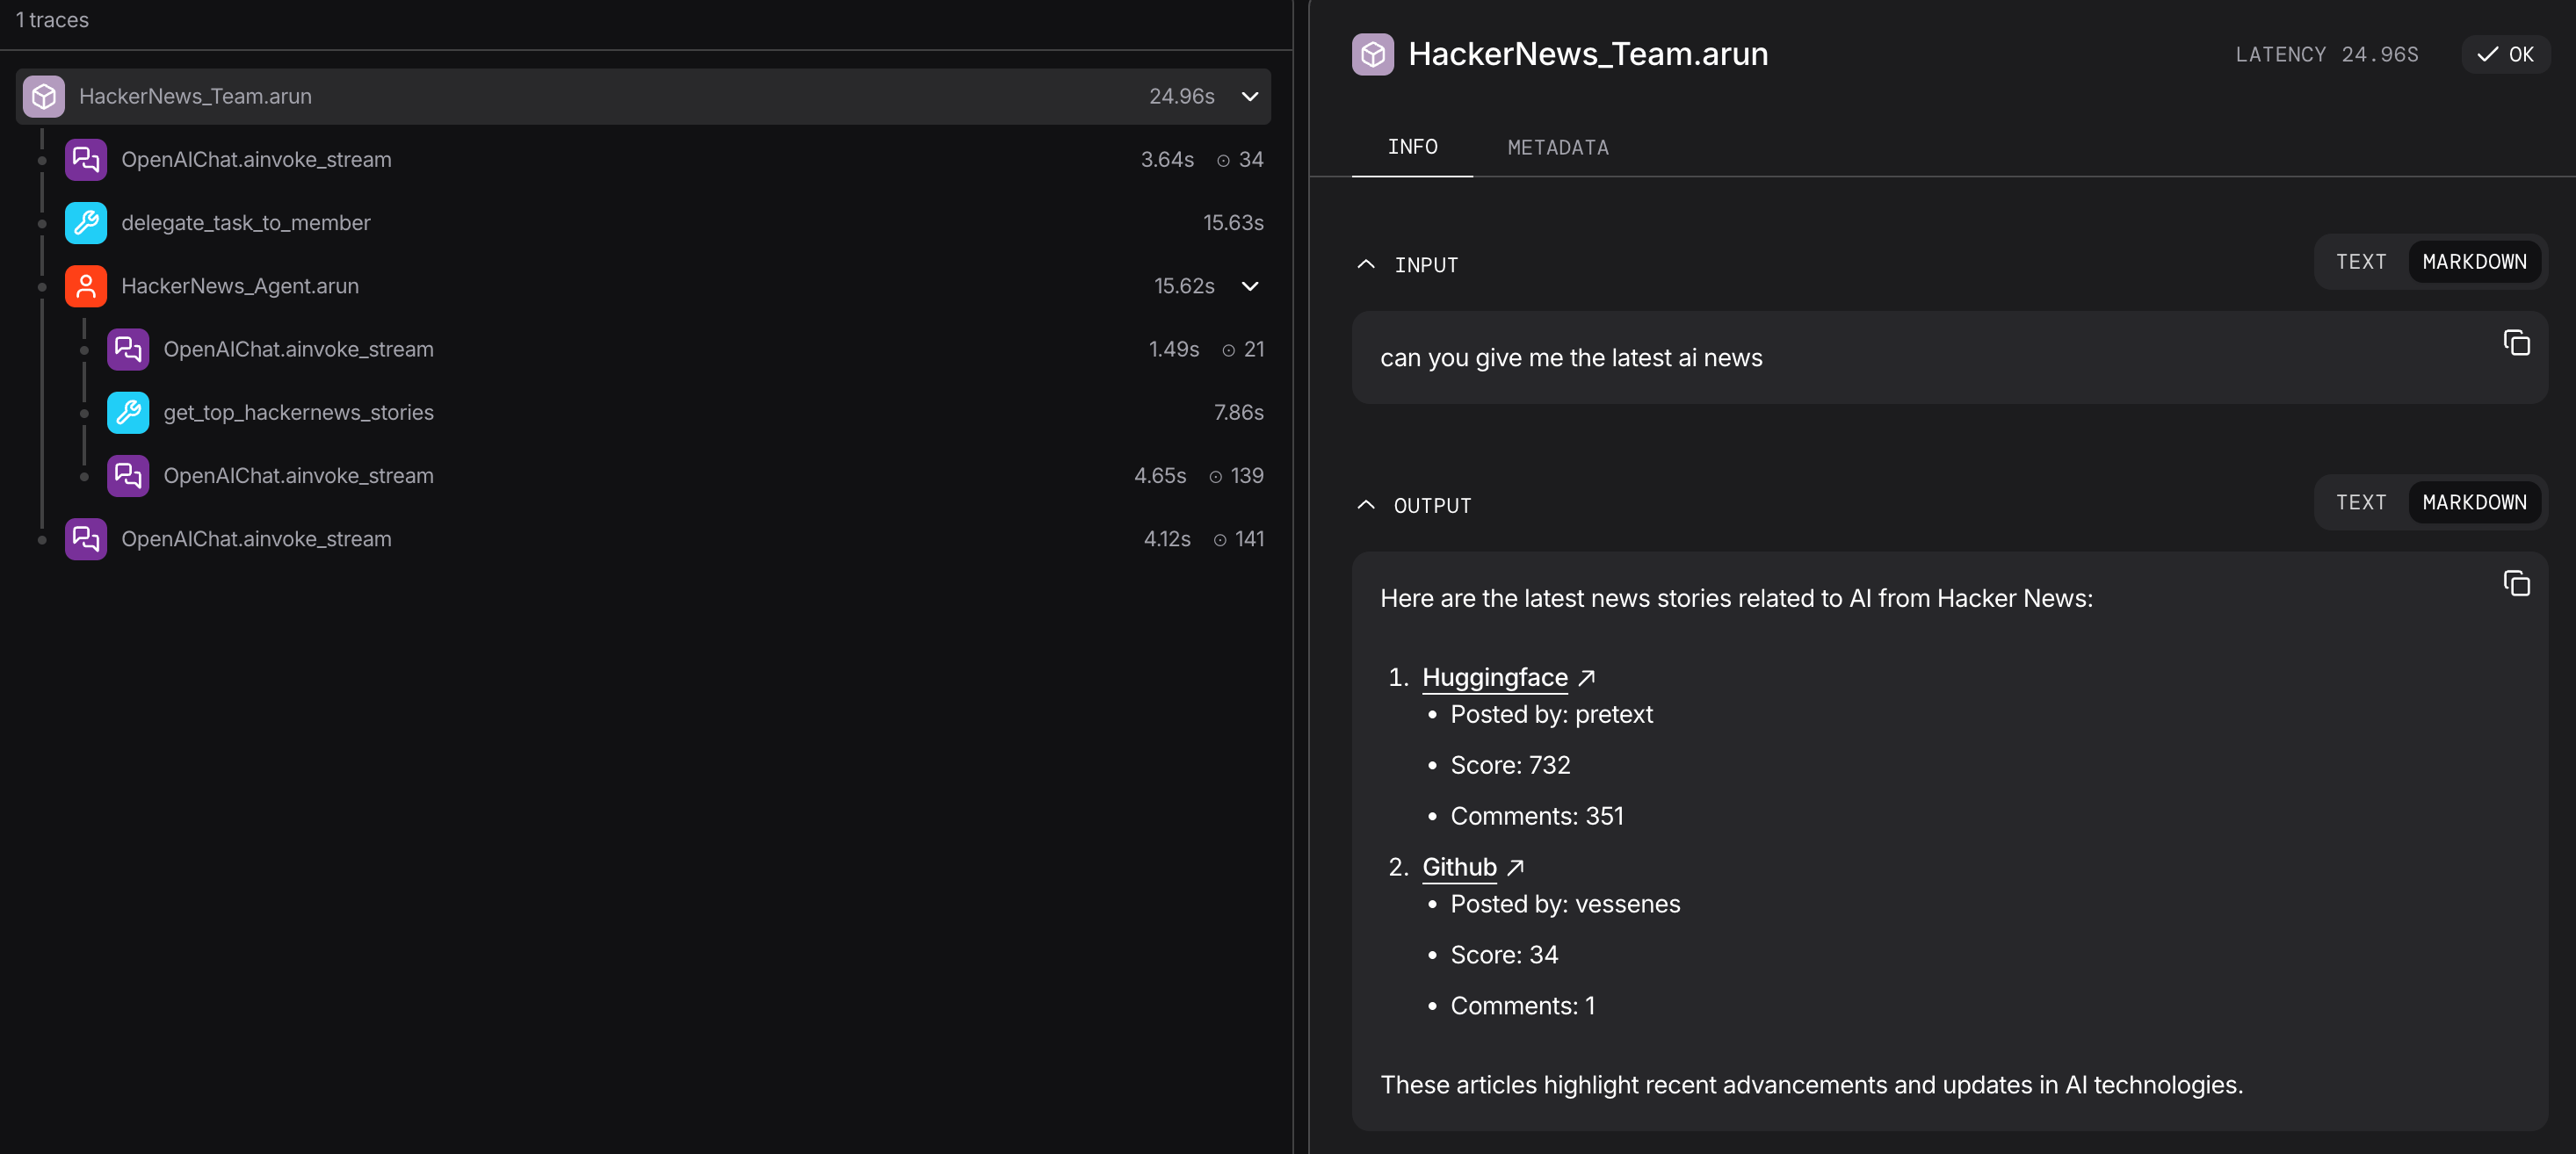
Multi-database tracing
Traces are high-volume and write-heavy, with a different cost profile, retention, and access pattern than sessions. For production, route them to a dedicated database by pointing the AgentOSdb at it:
db is where traces land. Keeping it separate isolates trace write volume from your agent data and gives you independent retention and scaling.
See Multi-DB tracing for the setup_tracing() variant with batch tuning.